Interactive tool · Preview
Drybench Assay.
Fit dose–response curves, interpolate standard curves and analyse qPCR Cq tables. Record a four-parameter fit with its inputs, settings and method version, ready to revisit.
Example data: The worked MTT example: three compounds on one 96-well plate. Generated from known parameters with a seeded noise model (pipeline/assay-analyser/generate_curves.py, MIT). Not a measurement of any compound.
- Free to use
- Runs in your browser
- Transparent methods
Illustration · Explore the real workspace below
See the tools at work.
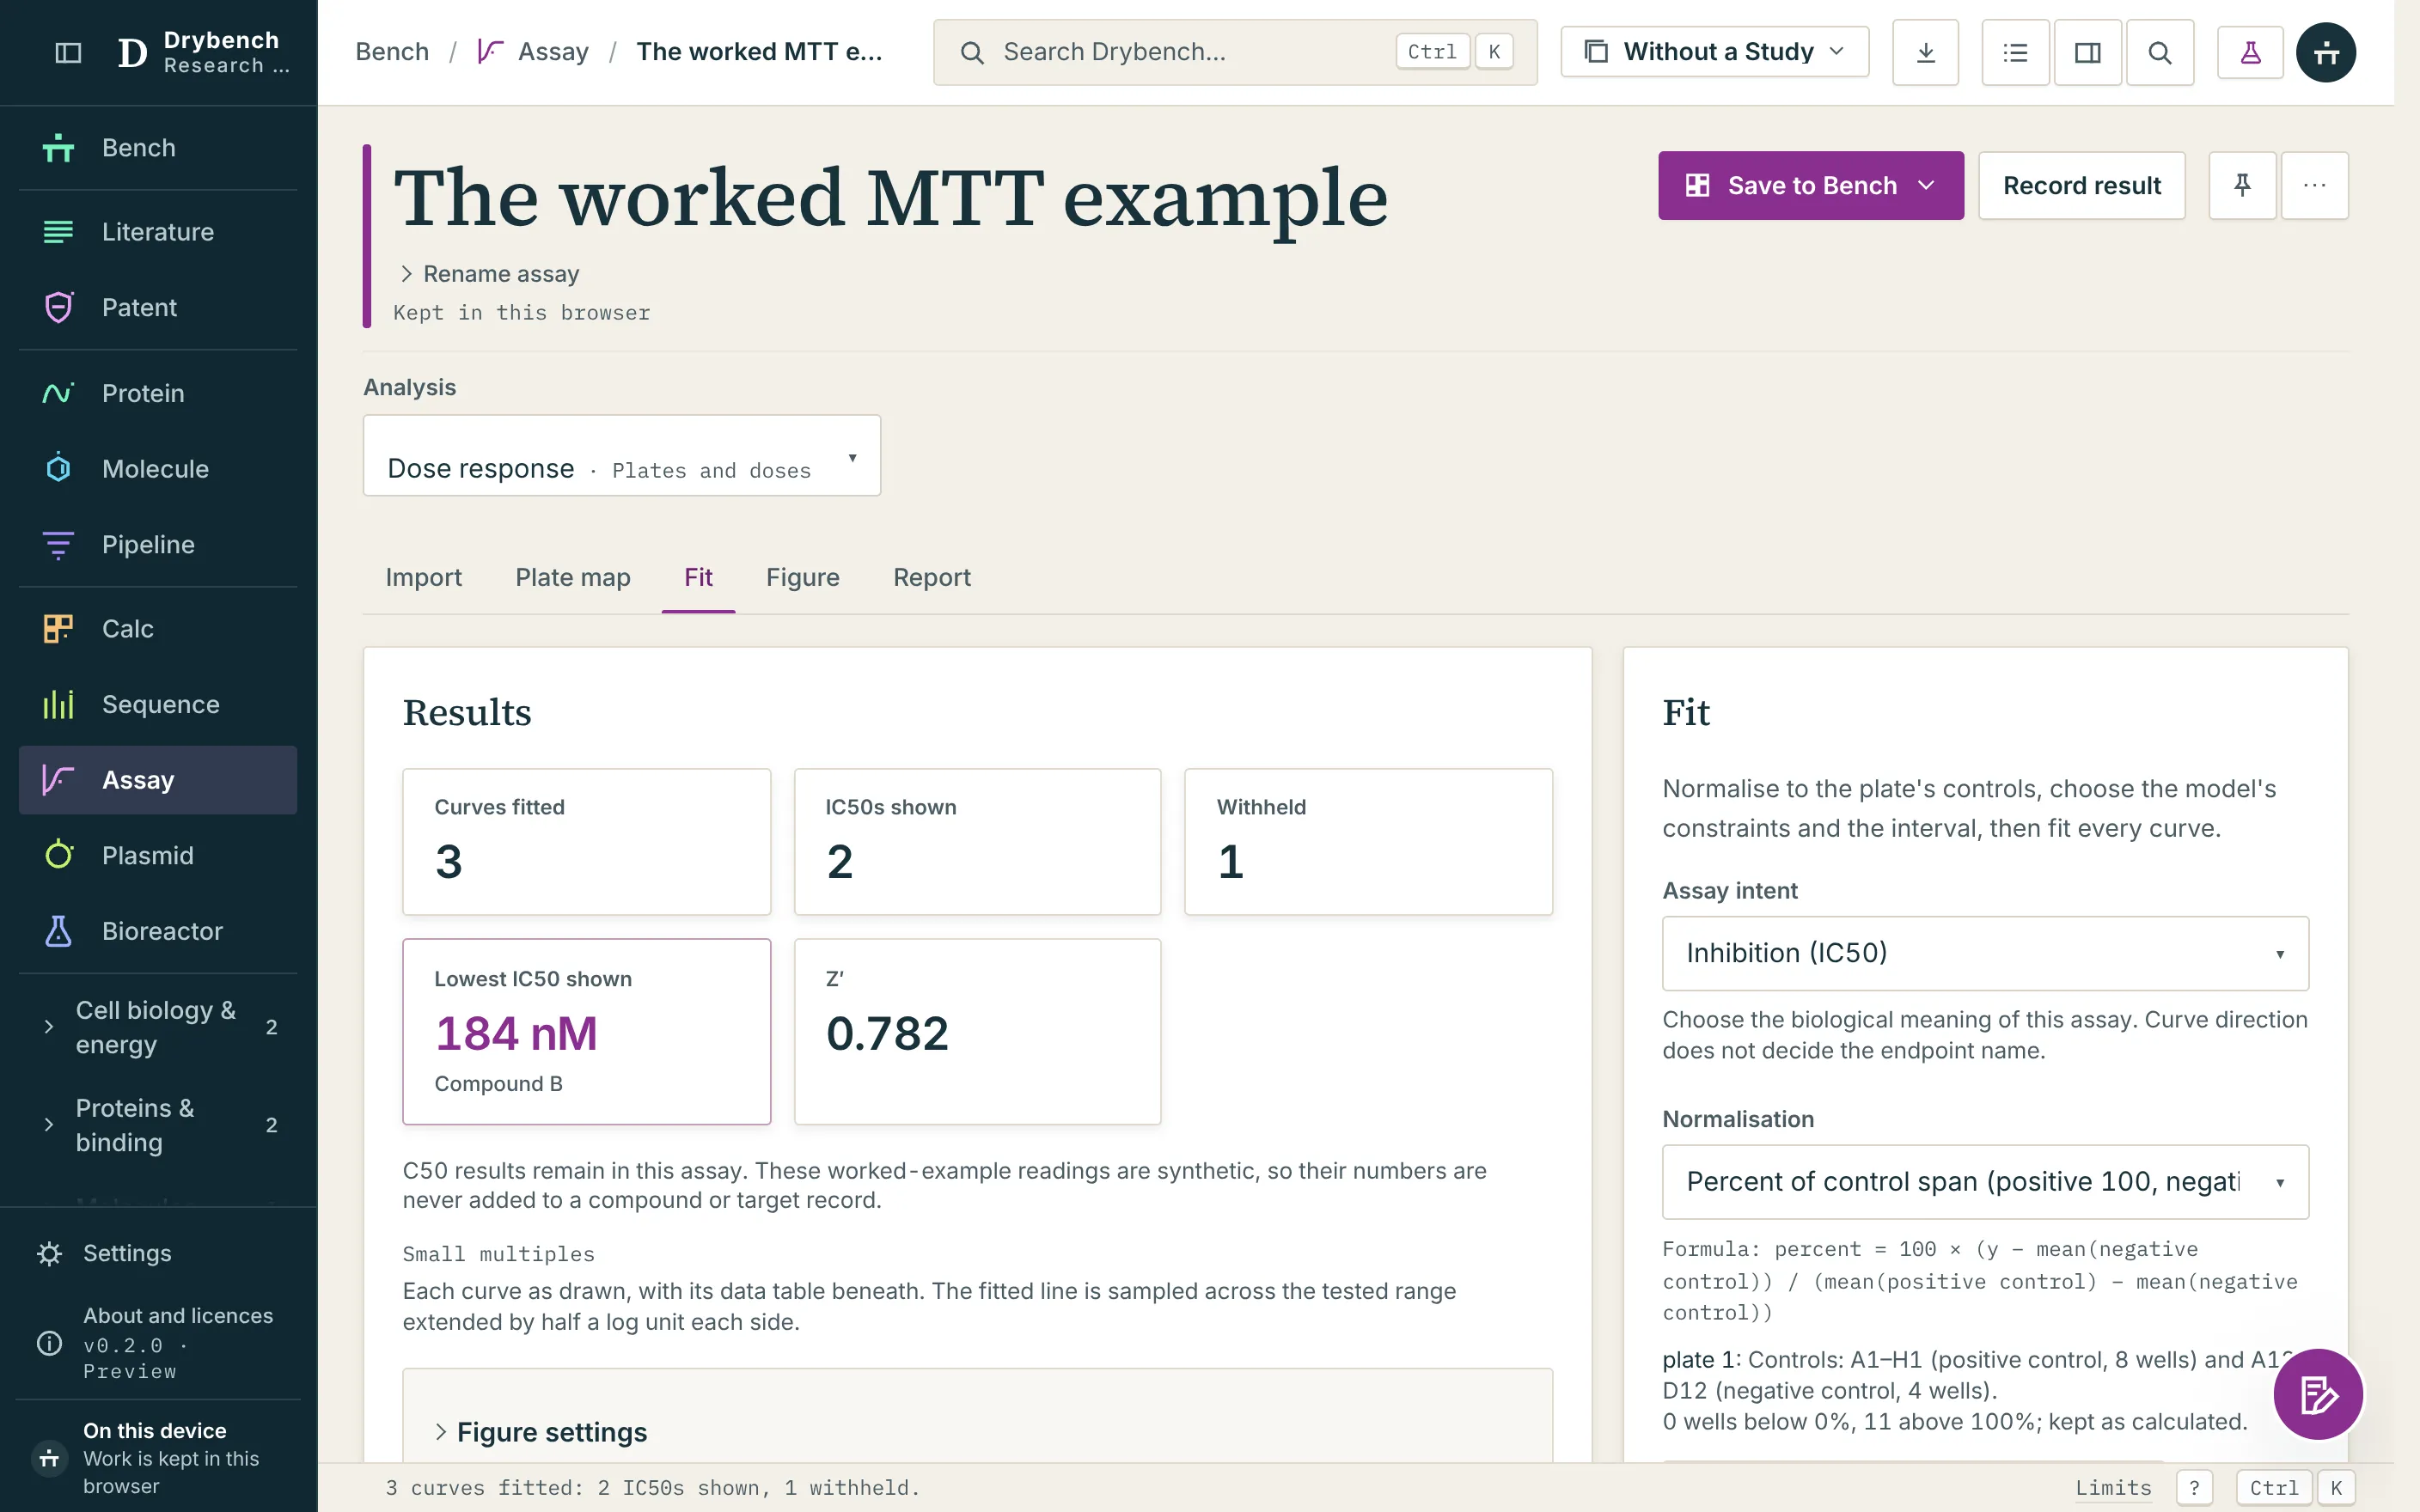
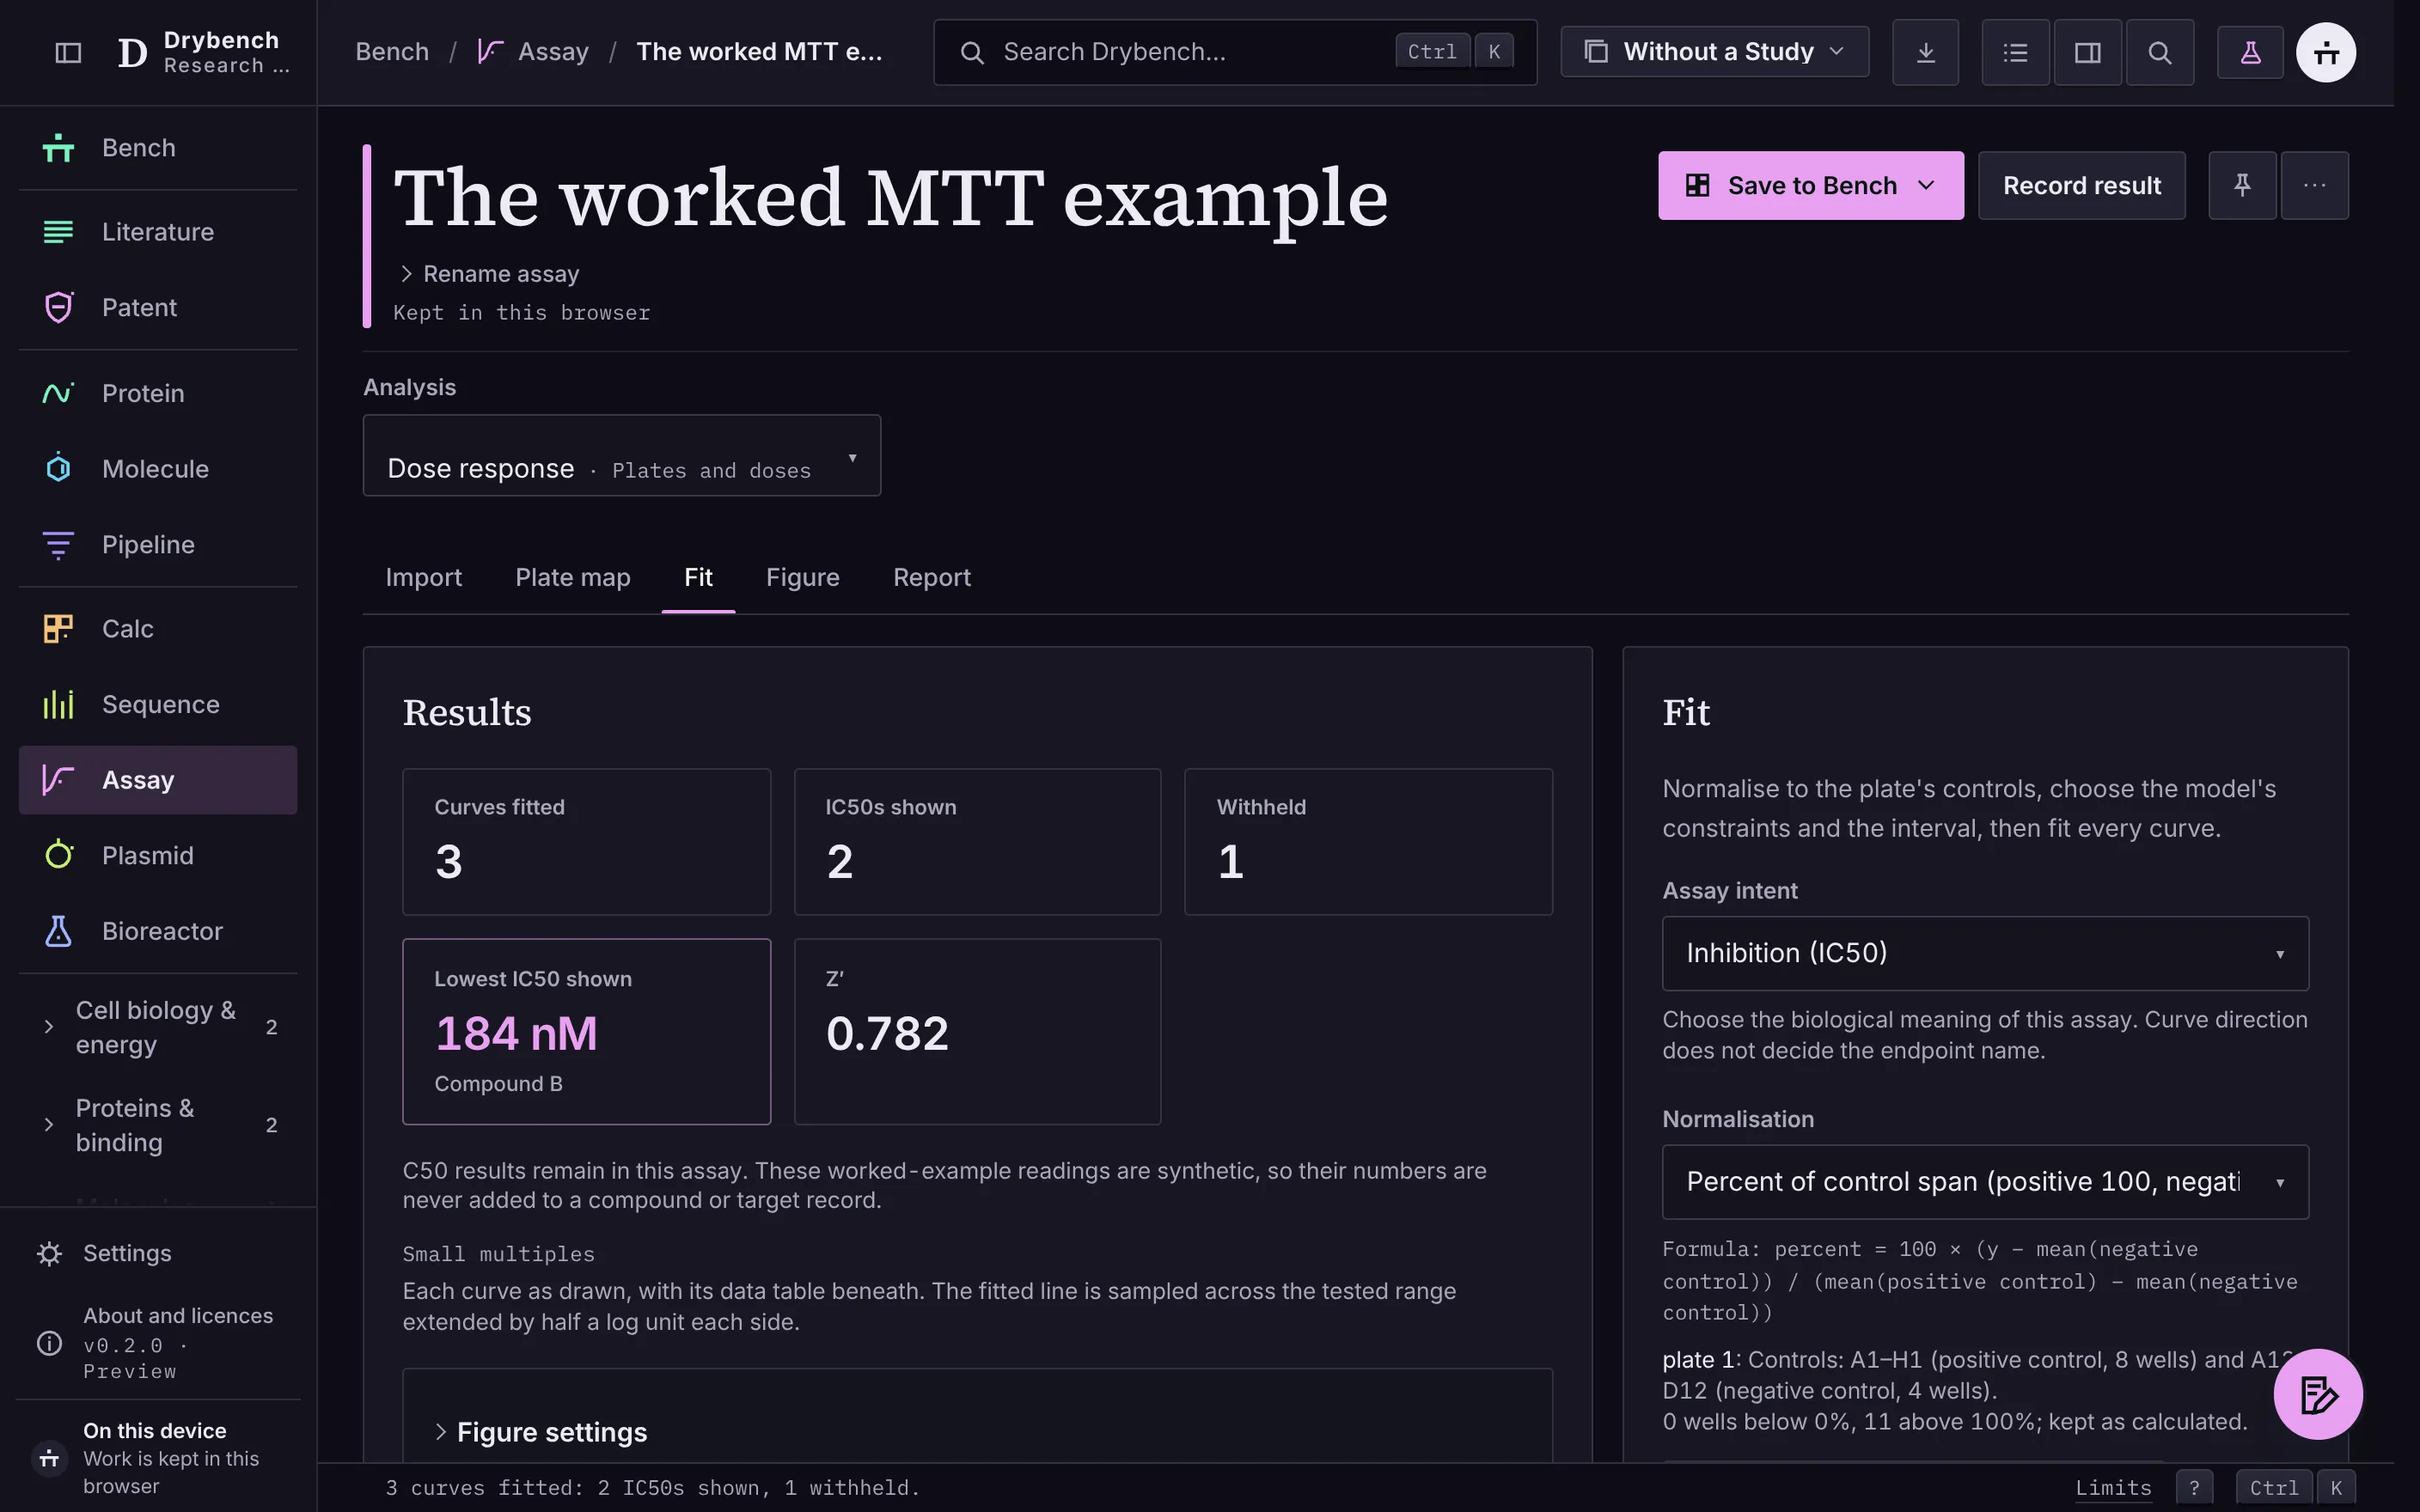
The structure drawings load the shared RDKit engine (about 2.4 MB of WebAssembly) only when a SMILES column is present.
What you can do with it
Plate exports and tables
A plain grid or another recognised plate layout at 96 or 384 wells is read by its structure, the detection is shown and confirmable, the header is discarded, and a long or wide table with units in its column headers is read too.
A plate map by keyboard
Arrow keys move, Space selects, Shift extends, Enter assigns and a fill-series command lays a dilution series across the selection, with the well table as the same data for phones and the layout saved for next week.
Intervals, not just a number
Where estimable, unweighted fits have 95 percent profile extra-sum-of-squares or Wald intervals on log C50; relative IRLS and zero-residual-variance fits have no interval, and unresolved bounds are stated explicitly.
Withheld, with the reason
Fewer than four concentrations refuses the fit, a C50 the tested range does not bracket is withheld, a free plateau needs two concentrations beyond its bend point, and an unidentifiable or numerically unresolved fit states its reason instead of showing a number.
Relative or absolute C50
The curve's own midpoint or the crossing of 50 percent of the controls, defined side by side and switched with Sebaugh's conditions checked on the tested concentrations.
Z′ and QC as observations
Z′ per plate from the controls with sample standard deviations and n shown, a Hill slope read as steeper or shallower than one, and R² shown but not used as a gate: observations, not verdicts.
A method block you can cite
The equation, algorithm, weighting, constraints, interval method, exclusions, normalisation and version print as a block and copy as a paragraph, and the Prism CSV and the R snippet carry the same settings.
Checked against R, in the open
The engine agrees with R 4.3.3 nls and drc 4.0-0 LL.4 on 33 published synthetic curves and the worked MTT plate within tolerances stated on the verification page, where the fixtures and their hashes are published.
Start with a worked example
Explore a configured workflow with its starting data and methods ready to inspect.
- Synthetic example
4PL IC50 Curve Fitter with Plateau Coverage Diagnostics
Fit an interactive 4PL inhibition curve in your browser, pre-loaded with duplicate reference data. Inspect plateau coverage, residuals and C50 uncertainty.
Starting data: C03: duplicate inhibitor titration
Explore example - Synthetic example
96-Well Dose Response Plate Mapper with Control Layout
Explore an interactive 96-well dose-response map in your browser, pre-loaded with synthetic reference readings, control wells, blanks and dilution series.
Starting data: Synthetic MTT plate with assigned controls
Explore example - Synthetic example
Z-Prime Factor Calculator for 96-Well Plate Controls
Inspect interactive Z-prime plate QC in your browser, pre-loaded with synthetic reference controls. Compare signal separation, control scatter and limits.
Starting data: MTT reference high- and low-signal controls
Explore example - Synthetic example
EC50 and Hill Slope Calculator for Agonist Responses
Fit interactive agonist curves in your browser, pre-loaded with two synthetic reference series. Compare EC50, signed Hill slopes, plateaus and fit limits.
Starting data: C19 and C20 synthetic activation series
Explore example
More examples (8)
- Bell-Shaped and Biphasic Dose Response Curve Analysis
- ELISA 4PL Standard Curve and Unknown Interpolation Tool
- Morrison Tight-Binding Inhibitor Ki and Enzyme Titration
- Michaelis-Menten Km and Vmax Nonlinear Kinetics Fitter
- qPCR Delta-Delta Cq and Pfaffl Fold Change Calculator
- Thermal Shift DSF Melt Curve and Boltzmann Apparent Tm
- BCA and Bradford Protein Assay Standard Curve Interpolator
- OD600 Growth Rate, Doubling Time and Gompertz Curve Fitter
See the evidence behind the answer.
Explore the methods and sources behind the tools.
Read the methodsWhere every panel's data comes from
Hill 1910; Ritz, Baty, Streibig and Gerhard 2015 (the four-parameter logistic model)
Hill 1910; Ritz, Baty, Streibig and Gerhard 2015 (the four-parameter logistic model)Method (cited)The logistic form in log concentration, y = Bottom + (Top − Bottom)/(1 + 10^((logC50 − x)·Hill)), and the published LL.4 parameterisation the fixtures map to (e = C50, b = −Hill, c = Bottom, d = Top); no drc code is used or translated.
Hill AV. J Physiol 1910;40:iv-vii. Ritz C, Baty F, Streibig JC, Gerhard D. Dose-response analysis using R. PLoS ONE 2015;10:e0146021 (read 5 October 2026).
Levenberg 1944 and Marquardt 1963 (the fitting algorithm)
Levenberg 1944 and Marquardt 1963 (the fitting algorithm)Method (cited)Damped least squares with bounds by projection and an analytic Jacobian; the deterministic starting values are the suite's own, not drc's heuristic.
Levenberg K. Q Appl Math 1944;2:164-168. Marquardt DW. J Soc Indust Appl Math 1963;11:431-441 (from memory; brief §4.1).
Zhang, Chung and Oldenburg 1999 (Z′)
Zhang, Chung and Oldenburg 1999 (Z′)Method (cited)Z′ = 1 − 3(σpos + σneg)/|μpos − μneg| with sample standard deviations, and the 0.5 convention it is compared with as an observation.
Zhang J-H, Chung TDY, Oldenburg KR. A simple statistical parameter for use in evaluation and validation of high throughput screening assays. J Biomol Screen 1999;4:67-73 (read 5 October 2026).
Sebaugh 2011; Sebaugh and McCray 2003 (relative and absolute C50, bend points)
Sebaugh 2011; Sebaugh and McCray 2003 (relative and absolute C50, bend points)Method (cited)The relative C50 as the curve's own midpoint and the absolute C50 as the crossing of 50 percent of the controls; two concentrations beyond each bend point, at C50 × 4.6805^(±1/|Hill|), before a value is shown (the constant checked by arithmetic; the 2003 paper not yet read).
Sebaugh JL. Guidelines for accurate EC50/IC50 estimation. Pharm Stat 2011;10:128-134 (abstract read 6 October 2026). Sebaugh JL, McCray PD. Defining the linear portion of a sigmoid-shaped curve: bend points. Pharm Stat 2003;2:167-174.
GraphPad Prism user guides (the stated defaults, read as a behavioural reference)
GraphPad Prism user guides (the stated defaults, read as a behavioural reference)Method (cited): the defaults the guides state, no text copiedThe Prism 8 guide's statement that its initial default is the asymmetrical (profile-likelihood) interval and its discussion of asymmetric confidence bounds; the Prism 11 guide's account of 1/Y² weighting by the fitted curve. The CSV for GraphPad Prism (XY table) follows the XY layout the guide describes. GraphPad and Prism are trademarks of GraphPad Software LLC (Dotmatics); this app is not affiliated with or endorsed by them, and no agreement with Prism's numbers is claimed.
GraphPad Prism 8 and Prism 11 curve-fitting guides, read 5 and 6 October 2026.
RDKit.js 2026.03.6
RDKit.js 2026.03.6BSD-3-ClauseStructures drawn beside potencies when a SMILES column is present, in the shared Web Worker the molecule app also uses; it loads only then (about 2.4 MB of WebAssembly).
RDKit: Open-source cheminformatics. https://www.rdkit.org
The worked MTT example and the oracle fixtures
The worked MTT example and the oracle fixturesMIT (generated data; no third-party data)One 96-well plate of A570 readings with three compounds, vehicle and kill controls and blanks, generated from known parameters with a seeded noise model, and the 33 synthetic curves, control sets and oracle values the engine is checked against.
pipeline/assay-analyser/generate_curves.py and reference.R (the suite's authors, 6 October 2026).
PRISM Repurposing 19Q4
PRISM Repurposing 19Q4CC BY 4.0Per-well readings for the guided walk's example: erlotinib's wells and the control wells for HCC827 cells, secondary screen HTS002, three replicate plates. Normalised and fitted in this app; not the Broad's analysis.
DepMap, Broad; Corsello, Steven; Kocak, Mustafa; Golub, Todd (2019). PRISM Repurposing 19Q4 Dataset. figshare. Dataset. https://doi.org/10.6084/m9.figshare.9393293.v4
Pfaffl 2001, relative quantification in real-time RT-PCR
Pfaffl 2001, relative quantification in real-time RT-PCRMethod (cited)Efficiency-corrected relative expression in log space; explicit measured or assumed amplification efficiencies and calibrators.
Pfaffl MW. Nucleic Acids Res 2001;29:e45. Primary method reviewed 10 October 2026.
Hellemans et al. 2007, qBase relative quantification
Hellemans et al. 2007, qBase relative quantificationMethod (cited)Geometric normalization across explicitly selected reference assays. Reference stability, uncertainty propagation and inter-run calibration are not implemented.
Hellemans J et al. Genome Biol 2007;8:R19. Primary method reviewed 10 October 2026.
Where it runs and what it sends
This app declares no external public data hosts.
Anything in the address bar before the # (a search, a SMILES, an accession or a step) is sent to this site's host when a page loads or a link is opened; anything after the # is not sent.
Not used, by licence:
- drc, GRmetrics and nplr as dependencies. All three are GPL, so they run offline as oracles only; the model is implemented from its published equation and drc's starting-value heuristic is not used.
- GraphPad Prism help text, option names and checklists. GraphPad's copyright, so the guides are read for the facts they state and no text is copied; Prism is named only as a nominative comparison.
- AAT Bioquest, ConductScience, BioProcess Tools and MyAssays code or content. Competitor calculators are named in plain-text comparisons only; nothing of theirs is used.
- ChEMBL potency rows. ChEMBL's share-alike licence would attach to any row shown or exported, so literature potencies are links to ChEMBL pages only.
- Vendor plate-reader sample files. A vendor's sample export is its copyright, so the profiles are built and tested on files the suite generated itself.
- Hafner et al. 2017 (Dryad, CC0) as published reference curves. Not used: its open deposit holds normalised means only, without wells or controls.
- The Drug Repurposing Hub's sample annotations (mechanism, target, disease area, indication, phase, structures, sample ids). The Hub's sample sheet is provided for non-commercial use only, so none of its fields is used; the PRISM readings are copied by an allow-list of plate, well, dose, perturbation type and reading.
Built for research and education. The tools have not been validated for regulated use. Read the regulatory position
Make your next step a practical one.
Open the app and explore the example.